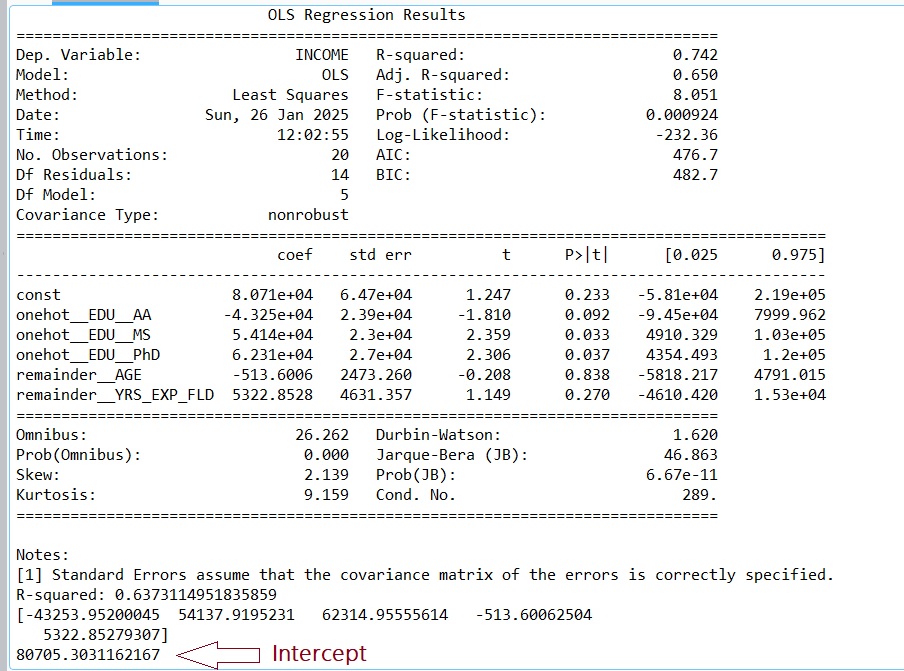
## Results are below.................
# -*- coding: utf-8 -*-
"""
Created on Sat Jan 25 18:29:48 2025

@author: profa
"""

#############################################
## Gates, 2025

## The following tutorial illustrates how to use
## Python to perform and interpret
## multiple linear regression on data that
## contains both quantitative independent variables
## and a categorical independent variable.

## The entire and original dataset is HERE
## https://drive.google.com/file/d/1f9FRqo1MaanGURS470xxTK29wQwqXTVt/view?usp=sharing
## The Dependent Variable will be INCOME
###################################################

import numpy as np
import pandas as pd
from sklearn.preprocessing import LabelEncoder
from sklearn.preprocessing import OneHotEncoder
from sklearn.model_selection import train_test_split
from sklearn.linear_model import LinearRegression
from sklearn.compose import ColumnTransformer
import statsmodels.api as sm

## Tell Python to print the entire dataframes - no ...
pd.set_option('display.max_rows', None)
pd.set_option('display.max_columns', None)

## Read in the data
## !! Your file path will be different from mine - be sure to UPDATE THIS
filepath="C:/Users/profa/Desktop/PT/IncomeDataset_Pretend_Gates.csv"
MyData=pd.read_csv(filepath)
print(MyData)

## Save the dependent variable as Y
## Save the indepdent variables as X
y=MyData["INCOME"]
print(y)
X=MyData.drop(["INCOME"], axis=1)
print(X)

## One-Hot Encode the Categorical Variable in X
categorical_variables_list = ["EDU_"] ##We have only one
#Instantiate
MyColTransformer = ColumnTransformer(
    transformers=[('onehot', OneHotEncoder(drop=[["BS"]]), categorical_variables_list)],
    remainder='passthrough'
)
# Perform the transformation
MyTransformedData=MyColTransformer.fit_transform(X)
print(MyTransformedData)

## Convert to dataframe
# Get the feature names
column_names = MyColTransformer.get_feature_names_out()

# Create a DataFrame from the transformed data
FinalDF = pd.DataFrame(MyTransformedData, columns=column_names)
print(FinalDF)
## Write the Final
file= "C:/Users/profa/Desktop/PT/IncomeDataset_Pretend_Gates_OneHot.csv"
FinalDF.to_csv(file, sep=',', encoding='utf-8', index=False, header=True)

## Split the data into training data (to train the model) and testing data
## to test the accuracy of the model
X_train, X_test, y_train, y_test = train_test_split(FinalDF, y, test_size=0.3, random_state=42)
print(X_test)
print(y_test)

# Create a Linear Regression model
MY_MLR_Model= LinearRegression()

# Fit the model on the training data
MY_MLR_Model.fit(X_train, y_train)

# Add a constant to the independent variable for statsmodels
X_sm = sm.add_constant(X_train)

# Fit the model with statsmodels
model_sm = sm.OLS(y_train, X_sm).fit()

# Print the summary
print(model_sm.summary())

# Make predictions on the test data
y_pred = MY_MLR_Model.predict(X_test)

# Evaluate the model
print("R-squared:", MY_MLR_Model.score(X_test, y_test))

## Print the regression coefficients
print(MY_MLR_Model.coef_)
## [-43253.95200045  54137.9195231   62314.95555614   -513.60062504    5322.85279307]

## Print the bias (the intercept)
print(MY_MLR_Model.intercept_) ## 80705.30  (rounded)

## The final linear model based on the coefs and intercept (rounded)
## y = -43254*x1 + 54138*x2  + 62315*x3   -514*x4  + 5323*x5   +  80705
## How does it work? Let's plug in some numbers to see if the result makes sense
## x1 is AA, x2 is MS, x3 is PhD, x4 is AGE, x5 is YRS_EXP_FLD
## Suppose a person has an MS, is 32, has 4yrs experience in the field
## y = -43254*(0) + 54138*(1)  + 62315*(0)   -514*(32)  + 5323*(4)   +  80705
## = 139687
Results