R can be used to prepare text data for analysis. Recall that text data can be in many raw formats, such as part of a corpus (a folder of text files), in a csv file, as HTML or JSON, etc.
One option for preparing text data is to tokenize the data, vectorize the data, and create a dataframe so that each word is a column and each document is a row (where a document can be a text document in a corpus, or a Tweet, or a review, etc).
R offers a method called “Corpus” which is part of the tm library and will read in a corpus. The following code example will illustrate:
- Reading text in from a corpus
- Using DocumentTermMatrix to tokenize and vectorize
- Removing punctuation, stopwords, and words of certain lengths and/or frequencies
- Making a wordcloud
- Using distance metrics and k-means
NOTE: In this code, you will sometimes see the use of the double colon, ::
The double colon is used to explicitly call a function or method from a specific library. For example, tm::Corpus tells us that the Corpus method comes from the tm library. This is a good coding style because it helps any reader to know where the method comes from.
The following code will show how to read in and vectorize text data that is stored as a corpus.
Text data can be store or gathered in many formats including a corpus (example above), a csv (or similar) file, .txt text files, or as HTML, XML, JSON, etc.
Often, YOU, have control over how you bring in your data. For example, if you are using an API to collect data, the API will likely have options you can choose from (such as HTML, text, or JSON) to receive the data. From there, YOU can determine if you want to write the incoming data into a corpus or onto a csv file or into a txt file, etc.
Each case is a little bit different.
For example, this small bit of code shows using the AirNow API to bring in text data, and then write it to a .csv file.
#############################################################
##############   Using the AirNow   API   ##################
##############################################################

## First - go to
## https://docs.airnowapi.org/webservices
## Register and get a login
## Log in
## Then click Web Services

## Option 1: Use the site to BUILD the URL
## https://docs.airnowapi.org/forecastsbyzip/query
## You will need a KEY - therefore you must register first as
## noted above.
#install.packages("httr")
library("httr")
library("jsonlite")

## Get the data
## BUILD THE URL
base <- "http://www.airnowapi.org/aq/forecast/zipCode/"

format<-"text/csv"  ## Notice I am choosing the option to bring in the data as text
zipCode="20002"
date="2019-11-16"
API_KEY="XXXXXXX   ###your key here  XXXXXXXX"
distance="25"

##This creates a URL that will call the API and GET the data
(call1 <- paste(base,"?",
               "format", "=", format, "&",
               "zipCode", "=", zipCode, "&",
               "date", "=", date,"&",
               "API_KEY", "=", API_KEY, "&",
               "distance", "=", distance,
               sep=""))


## The httr library in R has a method called GET that will
## get the data from the API using the URL we created.
(AirNowAPI_Call<-httr::GET(call1))

## Here, we can use the httr::content method to extract the text and
## then place it into a dataframe.
(MYDF<-httr::content(AirNowAPI_Call))
## Print to a file
AirName = "AirFileExample.csv"
## Start the file
AirFile <- file(AirName)
## Write the text data to file
write.csv(MYDF,AirFile, row.names = FALSE)
Here is what this code creates:
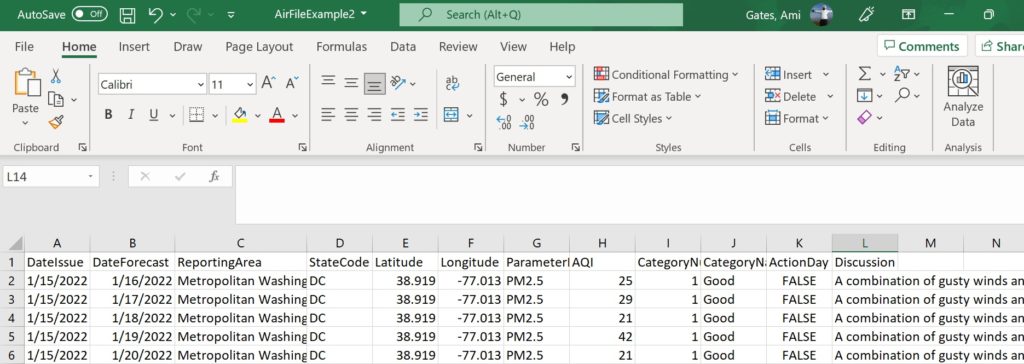
From here, you can read this data into R, can determine which portions you want to keep, and you can build (create) a dataframe of this data.
#####################################################################
## Open the file, read the data, and create a dataframe for analysis
#####################################################################
## Technically, we already have all of this data in MYDF. Have a look
MYDF
## But, let's read it in anyway to see how that works.
## This is where the data is located on MY computer ;)
filepath="C:/Users/profa/Desktop/GatesBoltonAnalyticsSite/DATA/AirFileExample2.csv"
(AirNowDataFrame <- read.csv(filepath))
## Is this a dataframe? Let's check
str(AirNowDataFrame)  ## Yes!
##What are the data types of the variables?
## We can see that DateIssue is type "chr".
## That's not right and to CLEAN this we will need to change it to a date type
AirNowDataFrame$DateIssue <- as.Date.character(AirNowDataFrame$DateIssue)
## There are many data types that will need to be corrected. This is common
## and always part of cleaning and preparing data.

## We can change statecode to factor type
AirNowDataFrame$StateCode <- as.factor(AirNowDataFrame$StateCode)

## When you are done making all needed changes - check the types again
str(AirNowDataFrame)

## This data is NOT yet ready for analysis. You have a column (variable)
## called "Discussion" that contains text data.

## One option for this is to remove the column, save it as csv,
## and then vectorize it as well.
There is no magic method or one-size-fits-all for data cleaning, gathering, exploration, and/or prep. There are tools you can use. How you use them is up to you and your goals.
Let’s pause for a second. Suppose you have text data and you are using R. You want to convert (reformat) the text into a dataframe where the words are the column names and the documents are the rows.
Remember that “document” just means group of text and can represent a row of text in a csv file, a novel in a text file, JSON code from a news article, HTML from a webpage, etc.
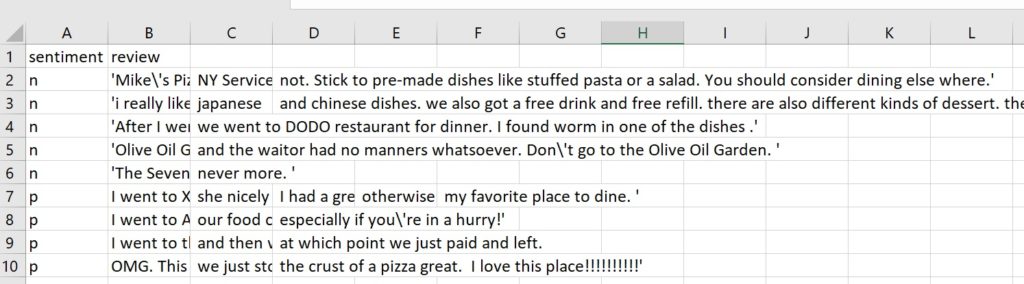
For this next example – let’s use a VERY small .csv file that contains text data:
Personally, I have found that using a corpus in R is fast and effective. Therefore, whether my text is in a csv file, or in a text file, etc., I reformat it so that is a collection of text files in a corpus.
If you are looking for other options, check out library superml which offers CountVectorizer in R, and/or text2vec.
STEPS
For step 1, because the .csv text data we have is messy and spans columns (which is a pain in the butt) let’s write it to a .txt file. The code and result follows.
## HERE is a copy of this dataset
## https://drive.google.com/file/d/1frni0dwDMo_3it8mRWWs78m8OBlwU0Ll/view?usp=sharing

filepath="C:/Users/profa/Desktop/GatesBoltonAnalyticsSite/DATA/RestaurantSentimentCleanerLABELEDDataSMALLSAMPLE.csv"

## Now for a little update that will just make things easier.
## You may have noticed that the csv file is a mess because the reviews are
## spread across many columns.
## Let's avoid this pain in the butt by writing the csv file to a .txt files first.

RawData <- read.csv(filepath, header=TRUE)

## Our new text file will be called MyRawData.txt
RAWFILE <- "MyRawData.txt"
write.csv(RawData, RAWFILE)

## Now, find and open the file called MyRawData.txt that is now on your computer.
## MINE IS HERE BELOW.....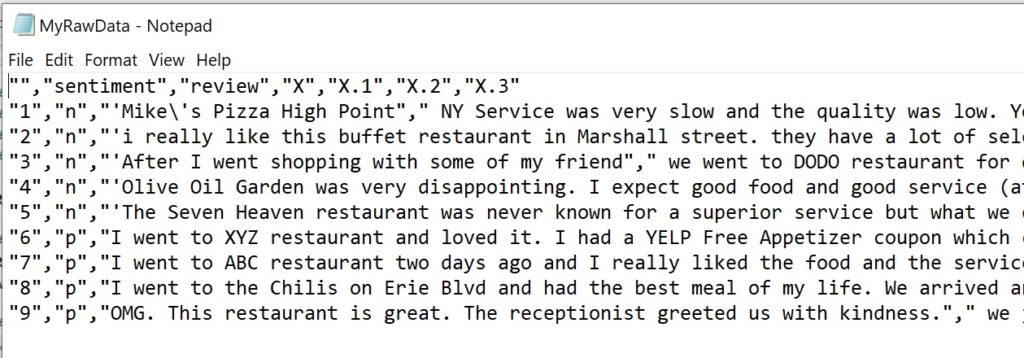
OK – one problem solved. We now just have a review for each row with no column issues. We also still have the labels. NOTICE that the first row is junk and we MUST BE CAREFUL when we go to the next step of vectorizing this.