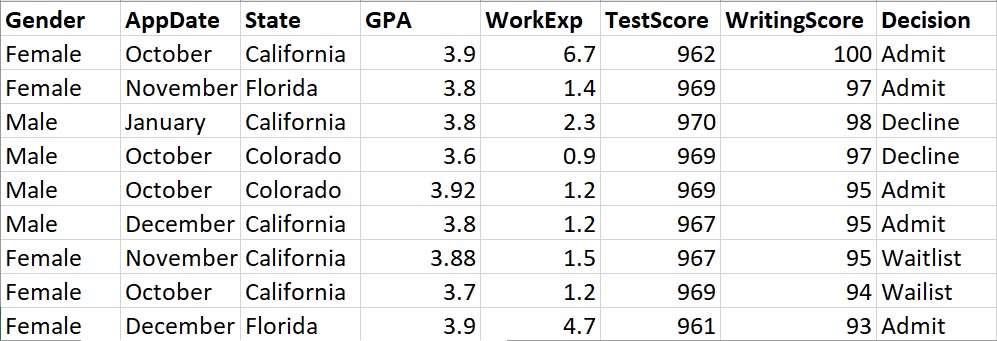
Record Data
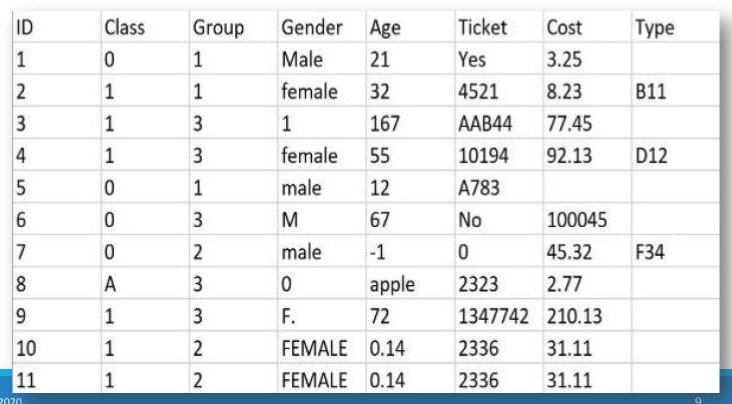
The above record data is mixed and needs to be cleaned and prepared before using. You can see that some variables are numeric, like Age, while others are qualitative, like Ticket or ID. While ID is represented using a number, it is not numeric data. Finally, you can see missing values, incorrect values, and data that you will not want to use if building a model.
Record data is a common format for data. Record data contains rows and columns. While there are always exceptions, the rows generally represent an observation and the columns represent the attributes.
Many different names are used to describe rows and columns.
Rows: Observations, instances, objects, people, vectors
Columns: Variables, fields, attributes, features, dimensions
This is important so that if a book, person, article or site refers to “feature engineering” for example, you know that they are talking about “engineering new columns”.
If you are told that your data has 4 dimensions, you know that this means it has four columns or variables.
If your data have 100 vectors, it has 100 rows or observations.
Record data can be mixed meaning that some variables are qualitative (names, categories, descriptions, etc.), while other variables may be quantitative (numeric). Variable can also describe times and dates or geographical locations (such as states or latitude/longitude).
Similarly, record data can be all numeric or all qualitative. The type of data that you have will affect which models and methods you can use.
Many formats of data can be put into record format. This is most often done using a programming language such as R or Python. For example, as you will see in the next section, text data can be gathered and then converted to record format for analysis.
To learn more about data cleaning, please review the data cleaning tutorial.
Text Data
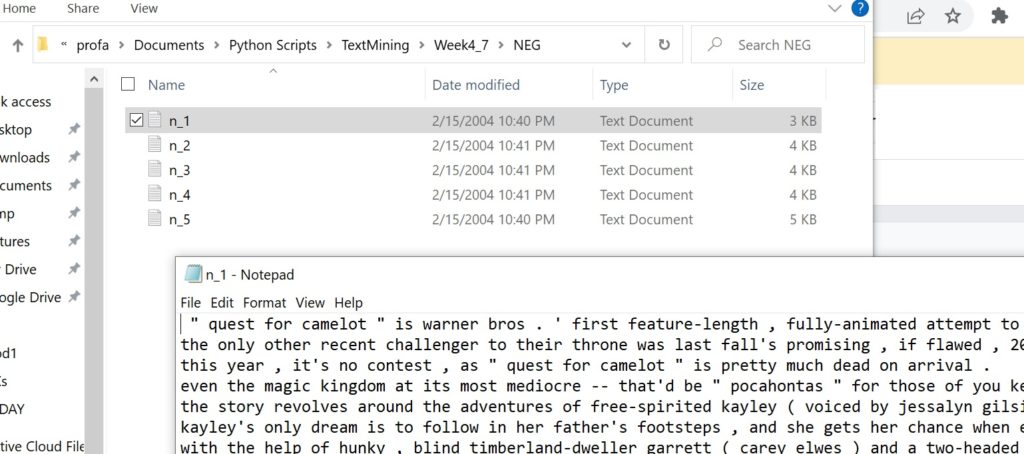
Text data is any data that contains words. This might be Tweets, chats, webpage HTML, novels, reviews, news articles, social media posts, etc.
Text data is often very messy and disorganized when it is first gathered. To apply analytical methods, such as machine learning modeling, to text data, it must first be cleaned and formatted.
First, think about text data. More specifically, let’s imagine three news articles – two on football and one on politics. All three articles use words (in our case we will focus on English only). So words like “and”, “the”, “but”, etc. will be in all articles. However, other words like “quarterback” are more likely to occur in the football articles and no so much in the political article.
In other words, the words in any collection of text (whether its an article or Tweet) will give you information about the topic(s), sentiment, etc.
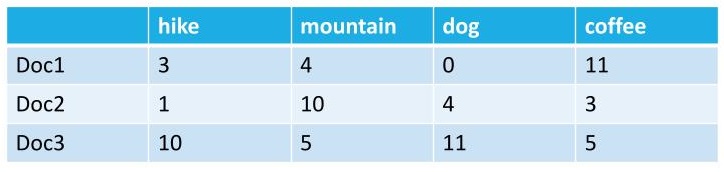
For example, if one document contains the word “hike” 27 times and “gear” 45 times, while another document contains the word “dog” 64 times and the word “cat” 23 times, we might start to surmise that one article is about hiking and the other is about pets.
So, you can think of the words in text data as being the variables.
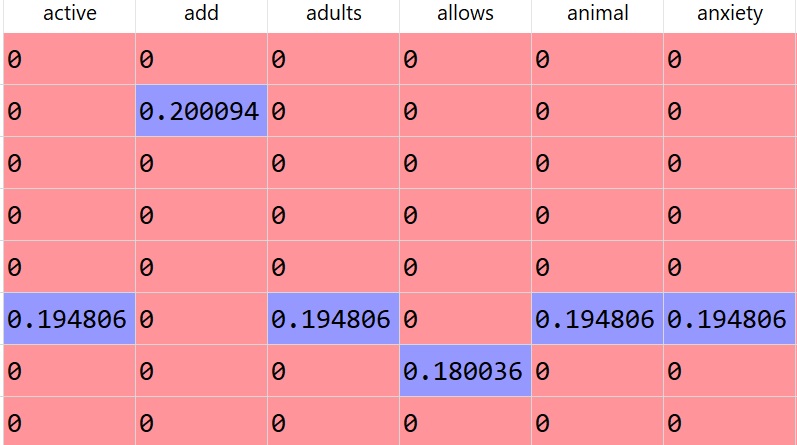
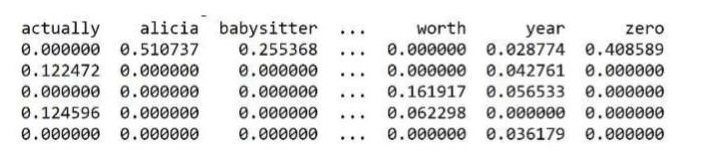
We can tokenize text data (break it into tokens – or words) and then we can vectorize (create a dataframe or matrix where the words are the column names and the documents are the rows).
This process of tokenize and vectorizing will convert text into record format. Keep in mind that a dataframe is record format.
Text data can also be transformed into transaction data.
The format we choose depends on the models or methods we want to use. For example, if using Association Rule Mining, we will need transaction data. If using SVMs we will need labeled record data, and so on.