The following code offers several Association Rule Mining examples with vis in R.
As always – this is my code so if you use it please reference me. Dr. Ami Gates, CU Boulder
####################################################
###
### Association Rule Mining Examples
### This example will use the Apriori Alg.
###
### Dr. Gates
####################################################
## To perform Association Rule Mining, transaction
## data is needed.
## MANY libraries will also be required...
##
## To perform association rule mining, you must have
## transaction data AND you must create a datafile
## that presents that data in whatever way your library
## expects. I will use *basket* here.
##
##
## TO GET this code to work and to get arulesViz to work -
## The HOW TO Tutorial for this is above
## you wil have to carefully and patiently do the following:
## DO these installs once
## install.packages("arules")
## For arulesViz to work on R version 3.5.x, you will
## need to first go through an installation of RTools.
## See HOW TO above.
## Next - once the RTools exe has been downloaded and installed
## per the instructions, then, do these install.packages here in RStudio:
#install.packages("TSP")
#install.packages("data.table")
## NOTE: If you are asked if you want to INSTALL FROM SOURCE - click YES!
#install.packages("arulesViz", dependencies = TRUE)
## IMPORTANT ## arules ONLY grabs rules with ONE item on the right
## install.packages("sp")
## NOTE R V3.5.0 does not use the older
## datasets packages
## install.packages("datasets.load") - not used here
## install.packages("ggplot2") - not used here
## install.packages("dplyr", dependencies = TRUE)
## install.packages("purrr", dependencies = TRUE)
## install.packages("devtools", dependencies = TRUE)
## install.packages("tidyr")
library(viridis)
library(arules)
library(TSP)
library(data.table)
#library(ggplot2)
#library(Matrix)
library(tcltk)
library(dplyr)
library(devtools)
library(purrr)
library(tidyr)
## DO THIS ONCE
## FIRST - you MUST register and log into github
## install_github("mhahsler/arulesViz")
## RE: https://github.com/mhahsler/arulesViz
##############
## IF YOUR CODE BREAKS - TRY THIS
##
## Error in length(obj) : Method length not implemented for class rules
## DO THIS:
## (1) detach("package:arulesViz", unload=TRUE)
## (2) detach("package:arules", unload=TRUE)
## (3) library(arules)
## (4) library(arulesViz)
###################################################################
## To see if you have tcltk run this on the console...
# capabilities()["tcltk"]
library(arulesViz)
## YOUR working dir goes here...
setwd("C:/Users/profa/Documents/RStudioFolder_1/DrGExamples/ANLY501")
###################################
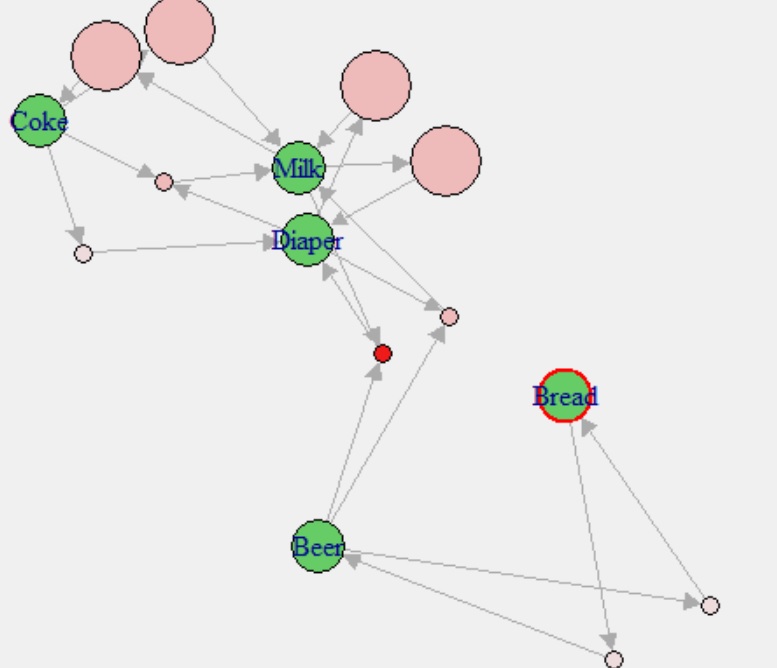
## Example 1: Kumar's Beer Example
##
## Dataset: https://drive.google.com/file/d/1BvU3iXtrwxfjBsRShaDgI-Ldh7Y3XSEn/view?usp=sharing
## KumarGroceriesAS_Transactions
##
## ## Dataset:
## HealthyBasket
## https://drive.google.com/file/d/1qaWSTwjrj7tNB43zLss9KC_ecJKp6W4g/view?usp=sharing
###################################################
FoodsKumar <- read.transactions("KumarGroceriesAS_Transactions.csv",
rm.duplicates = FALSE,
format = "basket", ##if you use "single" also use cols=c(1,2)
sep=",", ## csv file
cols=1) ## The dataset HAS row numbers
inspect(FoodsKumar)
##### Use apriori to get the RULES
FrulesK = arules::apriori(FoodsKumar, parameter = list(support=.35,
confidence=.5, minlen=2))
inspect(FrulesK)
## Plot of which items are most frequent
itemFrequencyPlot(FoodsKumar, topN=20, type="absolute")
## Sort rules by a measure such as conf, sup, or lift
SortedRulesK <- sort(FrulesK, by="confidence", decreasing=TRUE)
inspect(SortedRulesK[1:10])
(summary(SortedRulesK))
## Selecting or targeting specific rules RHS
BeerRules <- apriori(data=FoodsKumar,parameter = list(supp=.001, conf=.01, minlen=2),
appearance = list(default="lhs", rhs="Beer"),
control=list(verbose=FALSE))
BeerRules <- sort(BeerRules, decreasing=TRUE, by="confidence")
inspect(BeerRules[1:4])
## Selecting rules with LHS specified
BreadRules <- apriori(data=FoodsKumar,parameter = list(supp=.001, conf=.01, minlen=2),
appearance = list(default="rhs", lhs="Bread"),
control=list(verbose=FALSE))
BreadRules <- sort(BreadRules, decreasing=TRUE, by="support")
inspect(BreadRules[1:4])
## Visualize
## tcltk
subrulesK <- head(sort(SortedRulesK, by="lift"),10)
plot(subrulesK)
plot(subrulesK, method="graph", engine="interactive")
####################################################
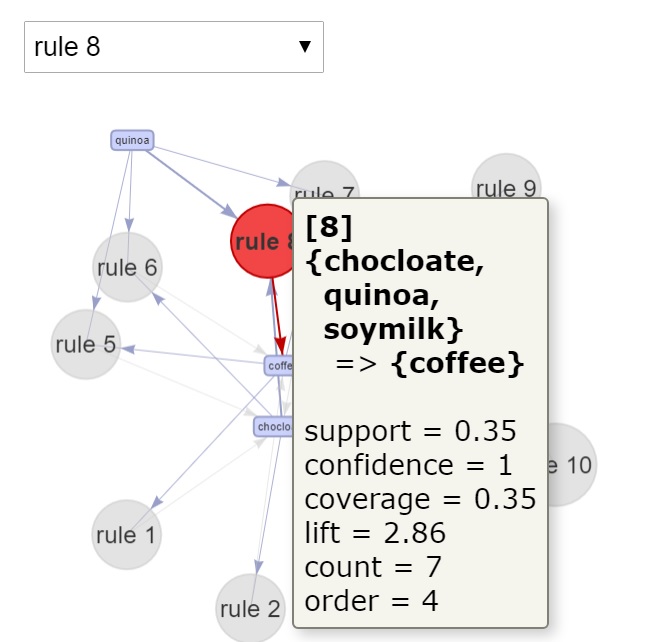
## Example 2: Healthy Food Transaction Data
##
## HERE IS THE DATA - but you should make your own dataset!
## https://drive.google.com/file/d/1qaWSTwjrj7tNB43zLss9KC_ecJKp6W4g/view?usp=sharing
##
##############################################################
Foods <- read.transactions("HealthyBasketData.csv",
rm.duplicates = FALSE,
format = "basket", ##if you use "single" also use cols=c(1,2)
sep=",", ## csv file
cols=NULL) ## The dataset has no row numbers
inspect(Foods)
##### Use apriori to get the RULES
Frules = arules::apriori(Foods, parameter = list(support=.35,
confidence=.5, minlen=2))
inspect(Frules)
## Plot of which items are most frequent
itemFrequencyPlot(Foods, topN=20, type="absolute")
## Sort rules by a measure such as conf, sup, or lift
SortedRules <- sort(Frules, by="confidence", decreasing=TRUE)
inspect(SortedRules[1:10])
(summary(SortedRules))
## Selecting or targeting specific rules RHS
ChocRules <- apriori(data=Foods,parameter = list(supp=.001, conf=.01, minlen=2),
appearance = list(default="lhs", rhs="chocloate"),
control=list(verbose=FALSE))
ChocRules <- sort(ChocRules, decreasing=TRUE, by="confidence")
inspect(ChocRules[1:4])
## Selecting rules with LHS specified
CarrotRules <- apriori(data=Foods,parameter = list(supp=.001, conf=.01, minlen=2),
appearance = list(default="rhs", lhs="carrot"),
control=list(verbose=FALSE))
CarrotRules <- sort(CarrotRules, decreasing=TRUE, by="support")
inspect(CarrotRules[1:4])
## Visualize
## tcltk
subrules <- head(sort(SortedRules, by="lift"),10)
plot(subrules)
#plot(subrules, method="graph", engine="interactive")
plot(subrules, method="graph", engine="htmlwidget")