Introduction to Machine Learning (ML) Concepts
Machine Learning (sometimes also called AI) is a collection of methods and models that can be used to discover information, patterns, and associations, and/or can model, classify, and predict.
ML methods can be supervised, unsupervised, semi-supervised, and reinforcement.
Supervised Methods:
Train models using data that has known labels or categories.
Example: Supervised methods use data that is labeled. Ths means that each row of data (or image etc. if working with other data formats) is KNOWN and part of a known group or class. For example, you might have data about movie reviews where each review is already known to be “positive”, “negative”, or “medium”.
With labeled data, models can be TRAINED to find the patterns that are most likely to result in one of the given labels. For example, the text in a positive movie review is likely to contain “happy” words like “good”, “great”, “loved”, etc. There are many examples of this and supervised methods seek to LEARN how to classify and predict data into a known category. Examples are Naive Bayes, Regression, Decision Trees, SVMs, etc.
Unsupervised Methods:
Use unlabeled data to discover pattern, categories, and/or associations.
Examples:
Unsupervised methods use data for which the structure, labels, and/or categories of the data are unknown. Clustering is a common unsupervised method that uses distance or similar measures/metrics to group (cluster) data rows (vectors) into clusters. Each cluster contains data rows that are similar to each other and distant from the data rows in other clusters.
Deep Learning using Neural Networks to discover patterns or information in data that is not labeled or structured.
Semi-supervised Methods:
Use a small amount of labeled data to attempt to label (and then use for modeling) larger datasets.
Sometimes, data is not labeled but we want to use it to train a model. Other times, we have a little bit of labeled data, but most is unlabeled. For example, suppose you download all the text for 1 million political Tweets. However, you do not know if the Tweet is a Republican, Democratic, or Independent tint or view.
By Hand: You can read each Tweet, and label it as R, D, or I. However, you do not wish to do this 1 million times :). So, instead, you do it, say, 100 times. Now you have some labeled data and a lot more unlabeled data. You then use the labeled data to start to build the model.
Within this area is also self-supervised and self-training, etc.
Reinforcement Methods: Use feedback or a reward system (positive and/or negative) in training and discovery.
Examples of Machine Learning methods:
- Clustering (unsupervised)
- k-means
- density-based and/or k-nearest neighbors
- hierarchical
- Association Rule Mining / Apriori (unsupervised)
- Principle Component Analysis and Independent Component Analysis (PCA and ICA) (unsupervised)
- Decision Trees (supervised)
- Naive Bayes (supervised)
- Support Vector Machines (supervised)
- Ensembles like Random Forest (supervised)
- Neural Networks/Deep Learning (supervised or unsupervised)
- ANN, CNN, RNN – supervised
- SOM, Boltzman – unsupervised
- Regression (supervised)
- Linear and multilinear
- Non linear
- Logistic
What is the key difference between unsupervised vs. supervised ML?
Before we look at the answer to this – let’s back up.
How can we program a machine (a computer) using a language like R or Python, to reveal, determine, discover, classify, or predict information?
Look at the following dataset:

Can you see patterns in this data?
- Can you see that the Label (which has three categories: Risk, NoRisk, or Medium) is associated with Cholesterol?
- Can you see other patterns?
- Can you see associations between other variables?
The answer is YES! Humans are pretty good with seeing patterns, especially those that are not too dimensionally complex.
But can we program a computer to see or find patterns?
In general and without going into a lot of math – the answer is…if there are patterns, we CAN program computers to find them.
Each Machine Learning method (or model) uses a different process (often a mathematical process) to identify/model complex patterns. This can be done with the goal of discovering patterns, groups, or associations (such as with clustering or association rule mining), or learning/modeling patterns with the goal of prediction (classification).
Entire books are written just on this topic – so we will only discuss some key elements.
LABELED vs. UNLABELED DATA
Consider these two datasets.
The one on the left is “labeled” data.
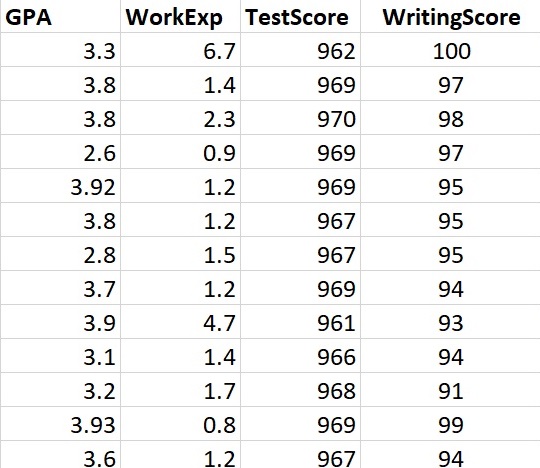
The one on the right is “unlabeled” data.
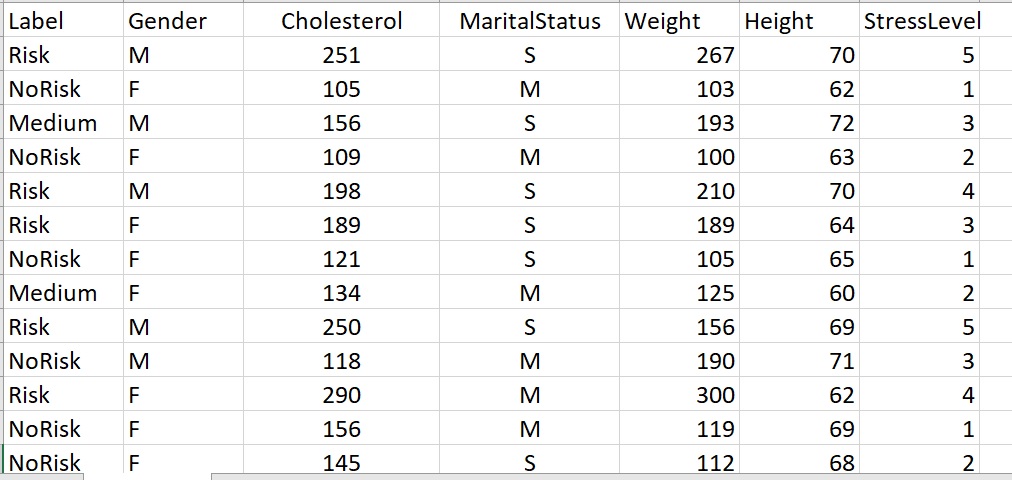
This is labeled data. The label is called “Label”.
What does it mean to be “labeled”?
It means that each row of the dataset is a member of a known group (also called a class or category). In the dataset on the left, there are three possible categories: Risk, NoRisk, and Medium.
Each row (each person in this case) is KNOWN to be in one of these three groups. In other words, each person is labeled.
For example, the first person (row) in the dataset on the left is a male person (M), their cholesterol is 251, they are single, their weight is 267, their height is 70 inches, and their stress level is a 5 (which is the highest). This person is in the category called, “Risk”. Their label is “Risk”
If we were to look at the data in each row and then the category of that row, we as humans will start to see patterns.
Person 2 (row 2) has data [ F 105 M 103 62 1] with a LABEL of “NoRisk”.
For each row, we can see the DATA and we can see the category or group that this data row is a member of.
As we look at each row of data (also called a data vector) and the label for that row, we can start to see that stress, cholesterol, weight, etc. are associated with specific categories of risk.
A computer can do the same thing – and often with greater accuracy!
Just by looking at this data, we can MODEL the data in our minds. In fact, this is what doctors do. The more patients they see, the more EXAMPLES they see of various disease labels or categories.
Now – suppose I told you that we have a new person who is not in the dataset.
This NEW person has data values: [F 111 M 98 60 2]
Can you PREDICT the label for this NEW person? Is it Risk, NoRisk, or Medium?
The answer is that – YES – you can make a very god prediction here of NoRisk because you have labeled data that shows you EXAMPLES (patterns) for each category.
This is what computers can also do!
Next – let’s consider the dataset on the right. The first row (person) is [ 3.3 6.7 962 100 ].
OK. So, can you make a prediction?
No – not yet – because you are NOT told what category or group each row (person) is a member of. You are not told how many categories (groups) there are, etc.
This is NOT labeled data.
Suppose I gave you a new row of data that is not in the dataset: [ 3.4 5.7 932 90 ]
What is the category for this new row? Can you tell?
NO – because again – you do not know that the categories are or how many categories there are.
IMPORTANT:
You (and R and Python) must have labeled data in order to build a predictive model!
SUPERVISED vs. UNSUPERVISED
Supervised methods TRAIN models using LABELED data.
The model learns from the examples (labeled rows) in the dataset.
If you do not have labeled data – you cannot use a supervised method.
Unsupervised methods do NOT require or use labeled data. Unsupervised methods can be used to discover categories, patterns, groups, or associations in the data.
Example 1:
Clustering methods (such as k-means) are unsupervised.
Clustering methods use measures of distance or similarity to cluster (group) data rows together. Rwos (also called vectors) that are similar will be in the same cluster.
Think about this for a second.
Look at the Heart Attack Risk dataset again – but without the label this time.
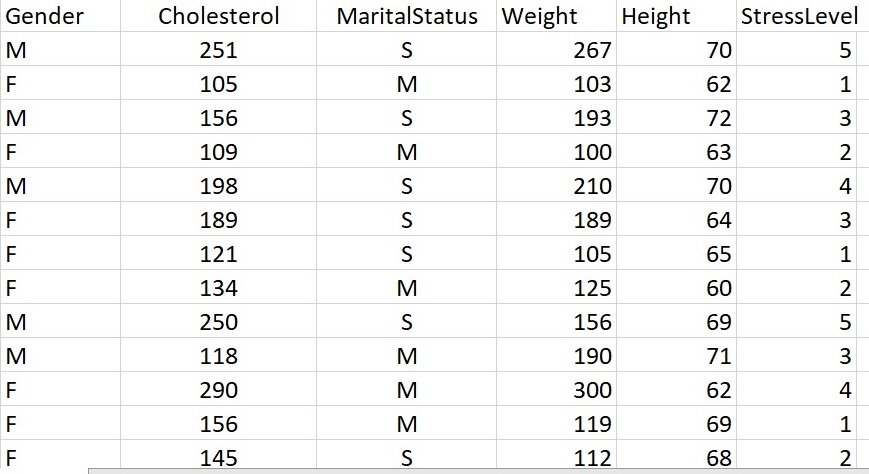
Heart Attack Dataset with no labels.
Could you cluster this data into groups?
Do you think the clusters would match the labels we have for this dataset (shown above)?
Do you think that [M 118 M 190 71 3]
is MORE SIMILAR to
[F 109 M 100 63 2]
or more similar to
[M 250 S 156 69 5]
Interesting question right!
What is very interesting is that we – as humans – can often SEE that one row is more similar to another row (or less similar).
Clustering methods can do this as well – but by using distance or similar metrics. More on that later.
The key idea here is to note that unsupervised methods DISCOVER groups or associations.
Example 2:
Naive Bayes is a supervised ML method.
Labeled data is used to TRAIN the model.
Once you have the model, you can then use the model on new data (for which you have no label) to predict what the label is.
TRAINING DATA AND TESTING DATA
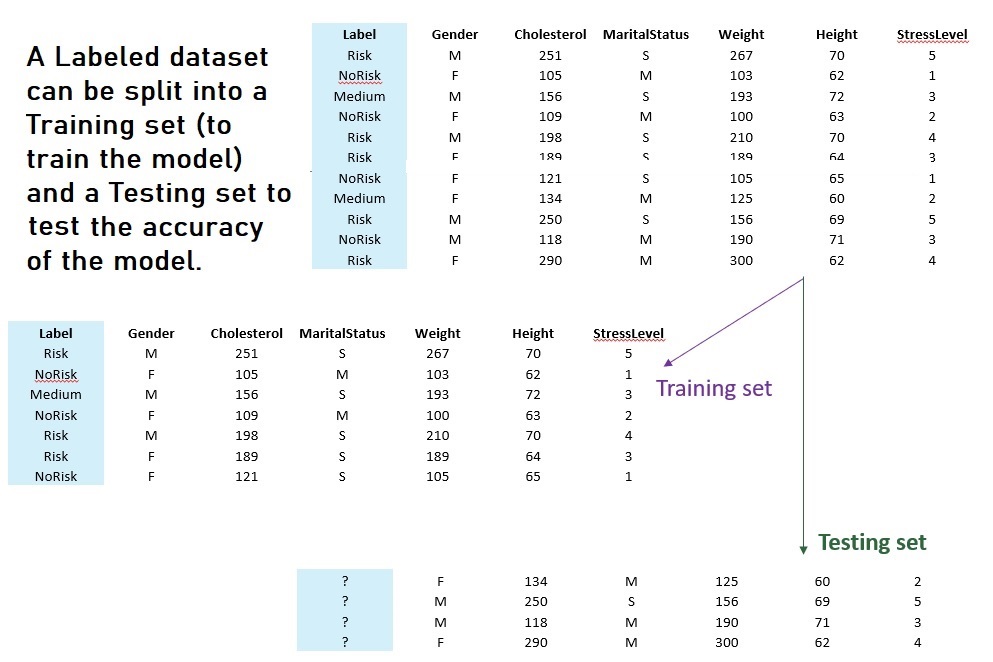
Supervised methods such as Naive Bayes, Decision Trees, Support Vector Machines, etc. will use a TRAINING set to train the model (the data must have labels) and then a disjoint TESTING set to test the accuracy.
Notes:
- Each ML method is unique. This means that some methods only work on numeric data, others work only on transaction data, and other work on mixed data.
- Different programming languages and libraries within those languages will have different parameter requirements.
- Some methods will offer greater accuracy than others depending on the nature of the data.
In other words – ML is not a one-size-fits-all. Rather, you should think of ML as a large tool box. The more you understand the tolls, the better you will get at using them 🙂