Text data are data that contains words.
Unlike record data that is already formatted as rows and columns, text data can be very disorganized.
For example, text data might come from data gathered using an API with results in JSON, or text gathered from webpage sources with results in HTML, or text from news articles, movie reviews, speeches, novels, etc.
Anything written/typed is text data.
In Python, we can use methods like CountVectorizer or TfidfVectorizer to convert text data into a dataframe format.
It is strongly recommended that you review the webpages for these methods. These two methods (CountVectorizer and TfidfVectorizer) are part of Python’s sklearn, Sklearn (short for scikit-learn) contains a very large number of machine learning and related tools for Python.
EXAMPLE CONCEPT
Before moving forward, let’s look at a small and simple example that will help to clarify the goal of
text –> dataframe.
Suppose you have three Tweets:
Tweet 1: The chocolate factory was great. All the chocolate was delicious.
Tweet 2: Chocolate is great and the factory was really fun.
Tweet 3: Check the new rock climbing gym. Rock climbing is great.
Next, notice that each Tweet can be thought of as a “document” (a collection of words).
We can use all the Tweets to define a vocabulary. All the words in our three Tweets are:
Vocabulary = (chocolate, great, factory, fun, delicious, check, new, rock, climbing, gym)
Notice that I did not include all the words. I left out “stopwords” like “and”, “was”, etc.
To represent these three Tweets as record data – as a dataframe – we create a dataset so that each word is a column name and each Tweet (document) is a row. For example:
| chocolate | great | factory | fun | delicious | check | new | rock | climbing | gym | |
| Tweet1 | 2 | 1 | 1 | 0 | 1 | 0 | 0 | 0 | 0 | 0 |
| Tweet2 | 1 | 1 | 1 | 1 | 0 | 0 | 0 | 0 | 0 | 0 |
| Tweet3 | 0 | 1 | 0 | 0 | 0 | 1 | 1 | 2 | 2 | 1 |
Notice a few things.
First, the dataframe we have here is numeric!
This means that we can use machine learning methods (like clustering) on this data. Next, notice that the words are the variables. Each row represents a document (a Tweet in this case). Notice that each row is a numeric vector. We can find the Euclidean distance between each row (Tweet) here and can determine which Tweets are more similar. You can likely guess the outcome – but I challenge you to TRY IT!
The following example and code will show the a few of the common methods for going from text to a dataframe. Keep in mind that text can be in csv, in a corpus, in multiple corpus’s, in .txt., as JSON, etc. Therefore, the following examples are SOME possibilities – never all.
Python Code Examples for TEXT –> Dataframes
In this first example, we will use CountVectorizer from scikit-learn (also called sklearn for short).
CountVectorizer will tokenize, vectorize, and clean text data. It offers many options and parameters.
Tokenizing text data means that you break the data (the words because its text) up into tokens are parts. Normally and simply, we can tokenize (break up) our text files into individual words. It is also possible to token into pairs of words like “not happy” (called a bi-gram), etc.
What would doing this by hand look like?
Suppose we have a tiny document:
“This is a tiny text document. It is small document but represents the idea of a collection of text”
If we tokenize into words (using space as the delimiter) we have the following. All punctuation and capital letters are auto-removed.
Vocabulary = (this, is, a, tiny, document, it, small, but, represents, the, idea, of, collection, text)
There are no repeats.
This vocabulary list of all the words in our document also contains the stopwords. Stopwords are words that contain no mean, information, or sentiment, such as “and”, “of”, “if”, “the”, etc.
We can choose to let CountVectorizer remove all stopwords. If we do, our list looks like this:
Vocabulary = (tiny, document, small, represents, idea, collection, text)
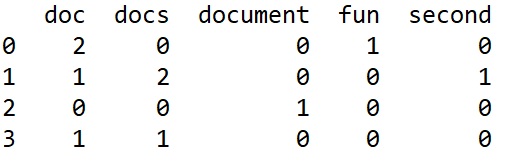
Next, CountVectorizer will vectorize. This means it will create vectors (rows) of data where each row is a document and each column is a word.
Here, we only have one document, so we will only have one row. We have 7 words so we will have 7 columns.
| tiny | document | small | represents | idea | collection | text | |
| Doc 1 | 1 | 2 | 1 | 1 | 1 | 1 | 2 |
This above table is a representation of tokenized and vectorized data (for one document) as well as the word counts. As you can see, “tiny” occurs once and “text” occurs twice.
If we had 100 documents, we would have a similar looking table (dataframe) with 100 rows (vectors) in it. The number of columns will depend on the entire vocabulary (all possible words) from all documents (with or without the stopwords).
From here, in Python, we can convert this CountVectorizer object into a pandas dataframe or into a matrix. We do this depending on the models or methods we next plan to use and what those models or methods expect.

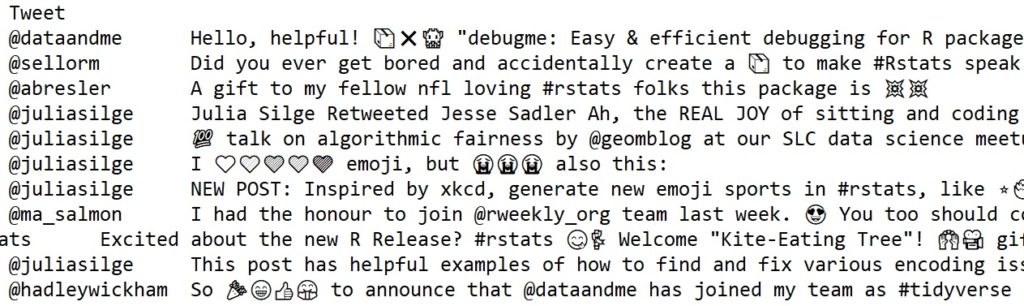
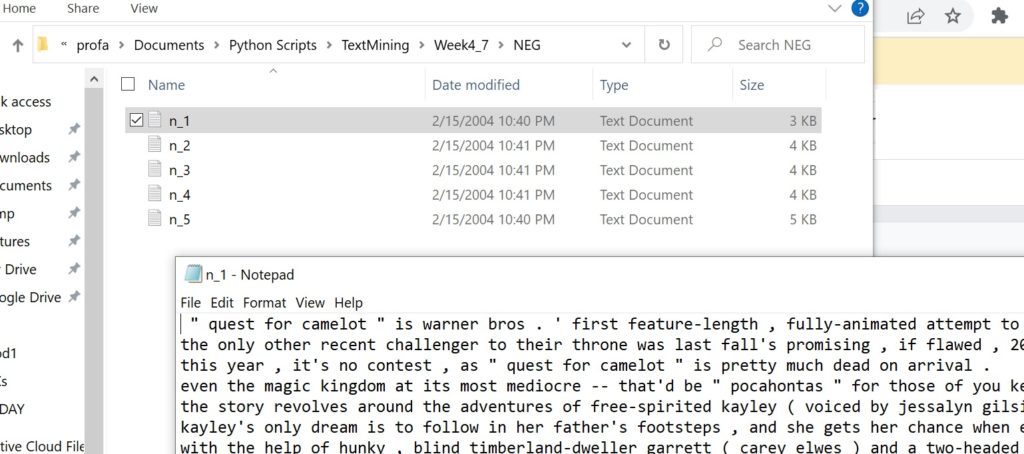
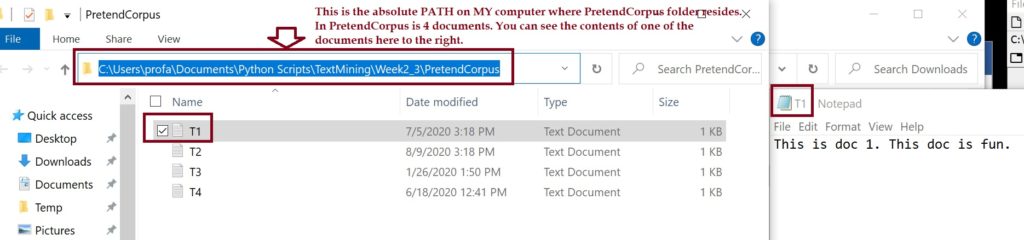
One of the challenges of converting text data into dataframes is that text data can be in MANY different starting formats, like JSON, HTML, XML, plain text, Word text (with hidden characters), csv, corpus, Tweets, etc. The images above show just a few.
Let’s start with a very simple example using CountVectorizer. This will enable you to try this in Python. Once this example works for you, you can move forward into more complex examples that will use .csv files, labels, and corpus’s, etc.
## CountVectorizer

from sklearn.feature_extraction.text import CountVectorizer
import pandas as pd

## Create a CountVectorizer that you can use
## *** NOtice here that the parameter input is set to content.

MyCV1 = CountVectorizer(input = "content",
                        stop_words="english")

##Let's use the easy way first..create a LIST of content

MyList=["My dog is great. I love my dog. Do not feed a dog chocolate.",
        "I love to hike. Mountains are great for a hike. A dog can hike too!",
        "A mountain hike is great and fun. Hike with the right gear, especially on a mountain."]

## Apply your CountVectorizer....
MyMat = MyCV1.fit_transform(MyList)
print(type(MyMat))  ## Its type

## Get the column names
MyCols=MyCV1.get_feature_names()
print(MyCols)

## COnvert it to an array
MyDF = pd.DataFrame(MyMat.toarray(), columns=MyCols)
print(MyDF)
CODE EXAMPLE 1
First, download and carefully review the code in the following link. As you review the code, be sure to create a corpus (as the code notes) to run the code on. Pay attention to paths (where your stuff is located on your comuter). In addition, review the CountVectorizer site. Notice, as one example, that the CountVectorizer function has an attribute called “input” which can be set equal to three options:
input{‘filename’, ‘file’, ‘content’}, default=’content’
- If
'filename', the sequence passed as an argument to fit is expected to be a list of filenames that need reading to fetch the raw content to analyze. - If
'file', the sequence items must have a ‘read’ method (file-like object) that is called to fetch the bytes in memory. - If
'content', the input is expected to be a sequence of items that can be of type string or byte.
You will see examples of using “filename” and “content” in the code here. We use “filename” when our data are in files that are in a corpus. We use “content” when our data are all in one document, like a csv file, a text file, or a list, etc.
Get this code to run and review each line. Once ready, go the following (and more advanced) code examples below.
The following links will take you to my Python code for various text cleaning and formatting. I say “my code” because there are always many ways to accomplish the same goals and my code shows examples of some methods.
CODE EXAMPLE 2:
TOPICS
### tokenization
### vectorization
### Dealing with a corpus
###  k means
### Dealing with a labeled CSV
### Distance measures
### Frequency
### Normalization
### Formats
###
### Gates
###
### !!!!! YOU will need to CREATE things to use this code

LINK TO CODE
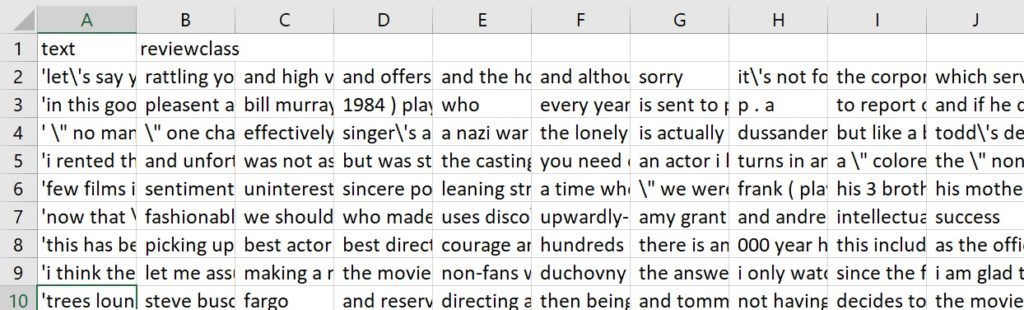
CODE EXAMPLE 3:

This next code example shows several things. First, it uses CountVectorizer to format (into a dataframe)  data that is in a .csv file and that is labeled.

To get started - look at the data first.

Next, review each line of code. NEVER just copy/paste someone else's code into Python, cross your fingers, and hit play. Use the code to learn what it does, how, and why. Use those TOOLS to then create code that you need for your goals.

This code also introduces TfidfVectorizer. This is similar to CountVectorizer, but it normalizes the data automagically for you using Tf-Idf.

This code is a TUTORIAL as well as a code example. This is true for all code that I share here. Read the comments in the code to understand each line. Experiment and try new things.

Other Topics In This Code:
1) Small functions using def
2) Loops
3) Working with LABELED TEXT DATA
4) Creating out files

LINK TO CODE


CODE EXAMPLE 4:

This example is a little bit more complicated because the text data is in a csv file and is labeled - BUT - the label is at the end of each row, is not always int he same place (so not all labels are in the same column), and the data is very messy.

Topics in the code example will include:
1) Using CountVectorizer (and input="content") to format text data that is labeled and from a csv file.
2) Dealing with labels that are not is an easy location.
3) Using some "hands-on" text clean-up with "strip".
4) Using regular expressions - such as sub and replace, etc.
This code has a lot more "hands-on" cleaning which is often critical when cleaning up text data.
5) Creates a labeled dataframe that could then be used for supervised ML (ML is not shown here - for ML etc. there are other tutorials).
6) Shows confusion matrix visualization
7) Shows a few more complex methods that you can look at or skip at this point.

LINK TO CODE


CODE EXAMPLE 5:

This example shows you how to use STEMMING with CountVectorizer.
LINK TO CODE


NOTE: At this point, you should be comfortable getting text data that is labeled or not and in a corpus or a .csv file into Python and converted to a dataframe. Remember- code examples NEVER work for all cases. They are examples of tools you can use and things you can do. But, each dataset is unique and will need its own steps to re-format.